What's new

What has been your most successful year as an enthusiast?

Matt N

CF Legend
Hi guys. With 2023 having recently started and 2022 having recently ended, there have been a lot of "2022 year in review" type threads around the internet for us to be able to talk about how good 2022 was for us. However, that might not reflect your most successful year as an enthusiast, so I'd be keen to know; of all the years you've been a theme park enthusiast, which would you say was your most successful? What year would you say you were most pleased with in terms of things you accomplished, or the number of new creds you rode, or the number of park days you had?

I'll get the ball rolling with my answer.

I could answer this question from the heart and talk about my own opinion of which year was most successful, but I thought it would be far more fun to try and answer it using various different statistics! There are so many different metrics by which you could determine a "successful" year, so I thought I'd try and explore a number of different coaster and park related statistics from my own enthusiast journey to see which years were best for me through different metrics...
Most New Coasters Ridden
Let's start with an obvious one; the number of new coasters I rode in a year! The top 3 years where I rode the most new coasters are as follows:
RankingYearNew Coasters Ridden
12014 and 201817
2201613
3202212
So by that metric, 2014 and 2018 are joint highest as my most successful year for new coasters, with a solid +17 being gained in both years! 2014 was a higher proportional gain to the count, as my 2013 count was vastly smaller than my 2017 count, but the raw gain is the same.

Most New Parks Visited
I might as well examine how many new parks I visited in each year too! The top 3 years where I visited the most new parks were as follows:
RankingYearNew Parks Visited
12014 and 20195
220163
320182
By that metric, 2014 and 2019 are joint highest as my most successful year for new parks, with a +5 being added to the park count in both years! As above, 2014 was a higher proportional gain due to my park count being smaller back then, but the raw gain is the same as it was in 2019.

Number of Coaster Rides
Riding new coasters is brilliant, but I'd argue that overall coaster rides could also be used as a success metric in itself! The top 3 years where I had the most coaster rides were as follows:
RankingYearOverall Coaster Rides
1202291
2202160
3201946
Interestingly, 2022, with 91 coaster rides having been taken, won the coaster ride stakes by an absolute landslide, beating out the 2nd place year by over 50%! Given that 2021 came second and 2019 came third, I'm clearly getting gradually better at riding lots of coasters in a year!

Number of Theme Park Days
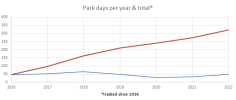
It's not all about the coaster rides, so you could also use your total theme park days as a success metric! The top 3 years where I had the most theme park days were as follows:
RankingYearOverall Theme Park Days
1201914
2201611
32014 and 20229
2019 was the year with the highest number of theme park days for me, with 2 weeks having been spent in theme parks in total that year!

Number of Unique Coasters Ridden
Having lots of coaster rides in a year is all well and good, but if loads of those are just you lapping a few rides over and over, that doesn't offer a lot of variety, does it? With that in mind, I reckon the number of unique coasters ridden could be another good success metric! The top 3 years where I rode the most unique coasters were as follows:
RankingYearUnique Coasters Ridden
1201932
2202229
3201626
2019 was the year where I rode the most different coasters, with 32 different coasters having been ridden in total!

Number of Unique Parks Visited
Spending loads of days at theme parks is all well and good, but if 90% of those days are just you visiting Alton Towers over and over again, that's not a very diverse visitation range. As such, I think that the number of unique parks visited could be a good success metric! The top 3 years where I visited the most unique parks were as follows:
RankingYearUnique Parks Visited
1201910
22014 and 20166
32018, 2021 and 20224
2019 was the year where I visited the most different theme parks, with 10 different theme parks having been visited in total!

So overall, I think I can ascertain that 2019 has probably been my most successful year so far, seeing as it topped many of the success metrics and appeared in the top 3 for the vast majority of them! There are all kinds of ways you could measure success, but of the ones I used, 2019 seems to come out on top.

But which year has been your most successful since you became an enthusiast? Whether you answer from the heart or take a more statistical route like I did, I'd be really keen to know!
 
The year I rode the most new coasters
#1 2022 (47 new coasters ridden with notable cred-intensive moments including Wales, Flamingo Land and several Wacky Worm trips)
#2 2021 (33 new coasters ridden with notable cred-intensive moments including Paultons Park and an East Coast cleanup)
#3 2018 (21 new coasters ridden with notable cred-intensive moments including Alton Towers, Southport Pleasureland & Blackpool Pleasure Beach)

The year I rode the most coasters that have a place in my top 25
#1 2022 (8 entries)
#2 2018 (7 entries)
#3 2016 (4 entries)
#4 2014 (2 entries)
#5 2017 and 2020 (1 entry)

On the flipside...

The year I rode the least new coasters (starting from 2007, the year that I rode my first ever coaster)
#1 2011 (0 new coasters)
#2 2012 (1 new coaster)
#3 2008 and 2010 (2 new coasters)

With everyone else doing graphs, guess I should post mine too. Not sure how to get rid of the $, and that note on SBNO is to do with my coaster list directly below which has been cropped out

Screenshot_20230114-234631_Sheets.jpg
 
Last edited:
Most New Coasters Ridden
1. 2022 (79 new creds, from Florida, Belgium, Texas and Copenhagen)
2. 2020 (44 new creds, from a single Japan trip before everything shut down)
3. 2019 (25 new creds, pretty much from Energylandia + Legendia and Wallibi Holland)

Most New Parks Visited
1. 2022 (20)
2. 2020 (9)
3. 2019 (3)

Number of Coaster Rides
... Yeah, I don't keep track of this.

Number of Theme Park Days
1. 2022 (26)
2. 2020 (10)
3. 2016 (8)

Number of Unique Coasters Ridden
1. 2022 (79)
2. 2020 (44)
3. 2021 (27)

Number of Unique Parks Visited
1. 2022 (20)
2. 2020 (9)
3. 2021 (5)

I'm not really that surprised that 2022 and 2020 topped most of the categories, they're the only 2 years I've travelled on big trips. Basically every year/trip I did before that were single park trips dotted about here and there.
 
In before @HeartlineCoaster makes a mockery of this whole thing.

RankNew CoastersNew ParksNew SteelNew Wood
1st2010 (+114)2018 (+28)2018 (+85)2010 (+37)
2nd2018 (+99)2016 (+24)2016 (+84)2013 (+20)
3rd2016 (+98)2010 (+20)2010 (+77)2016 & 2018 (+14)

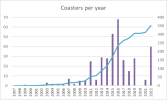
In graphical form:
7c7f7E9.png


I don't keep track long term of individual laps or visits, so can't pull out that information. Hazarding a guess though that it would be one of those years above, just on sheer likelihood alone.
 
Last edited:
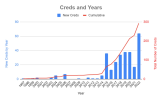
A good chance to chuck in my up-to-date Creds and Years graph...

1673599516959.png

And table:
RankNew CredsNew Parks
12022 (+64)2019, 2020 & 2022 (+9)
22019 & 2020 (+38)2015 (+7)
32015 (+36)2018 (+5)

2020 was a surprisingly good year considering Covid.

Last year was my most successful though; unsurprising considering it had a trip to America.

I don't track number of rides, visits, etc accurately enough to report on them.
 
I won't go into as much detail as the rest of you but in terms of new creds gained and parks visited it would be 2017, where I rode 90 different coasters of which at least 80 were new and visited parks in the US, Belgium and France as well as lots of new British ones.

In terms of riding top quality creds it would be 2022, where I got 4 new entries in my top ten steel and 5 in my top ten wood coasters, with big names like Steel Vengeance, Lightning Rod, Millennium Force, RMC Goliath, Mystic Timbers and Wildfire among them.
 
I did a lot of coaster focused trips after I finished high school, so 2015 and 2016 are leading the chart. Then my trips became less coaster focused and there was also a couple of years when I didn't do a whole lot due to either some personal setbacks and/or covid, before 2022 came swinging back into the top3.
1673600343471.png
rankingyearnew credspercentage of total count
1​
2016​
68​
19,3%​
2​
2015​
53​
15,1%​
3​
2022​
40​
11,4%​

The numbers are pretty similar for unique coasters ridden, only that 2022 has the edge over 2015, since there were quite a lot of revisits last year, while the places I visited in 2015 were mostly new.

rankingyearunique coasters
1​
2016​
89​
2​
2022​
69​
3​
2015​
54​

Coaster rides are something that I only started to keep track of fairly recently and my submissions to League of Goons helped quite a bit in making this stat possible for every year since 2014. Interestingly enough, 2019 just about edges out 2015 here (2015 misses out at 91 coaster rides). The numbers here aren't totally accurate, since I don't keep a track of fairground rides in this section of my spreadsheet. I feel that if I would add those, 2015 and 2016 would both get a considerable bump. Might get back at you with that one.

rankingyearcoaster rides
1​
2022​
177​
2​
2016​
116​
3​
2019​
93​

In terms of new parks visited, 2015 takes the cake...

rankingyearnew parkspercentage of total parks
1​
2015​
13​
16,9%​
2​
2016​
10​
13,0%​
3​
2019​
10​
13,0%​

And in terms of park visits, there's a tie at the top

rankingyearpark visits
1​
2015​
15​
2​
2016​
15​
3​
2022​
13​

And that's about it, I don't think I keep a neat way of the other stats in my spreadsheet, so I won't include them here.

Damn, even your new coasters per year chart looks like it would give some wicked airtime. ;)
 
As a non travelling old git, '94.
Nemesis, Big One and Shockwave.
Nothing been close ever since.
One long summer of coasters with the kids I worked with...managed a weeks paid holiday at Mingo and Lightwater that season too!
Lots of three hour queues though.
 
As much as it grieves me to say something nice about @DelPiero , when me n him did that big 'ol US road trip in 2018 - man, that was epic. Got more new creds in one 10 day bonanza than I did the previous 3 years combined, 78 I think was the final tally, including some real big-hitters - Vengeance, Dragster, Voyage, Beast, Boss, Outlaw Run, Time Traveler, Storm Chaser, Goliath etc etc...
Can't see me beating that any time soon.
 
Havent noted the year on my cred count - but its most surely my huge US trip in 2015. Started in NYC (SFGAdv, SFA) > Richmond (KD, BGW) > Knoxville (Dollywood, Carowinds - a 5h plus drive each direction as Fury just opened) > Louisville (KK, Holiday World, KI) > SFGA > Cedar Point > Waldameer > Kennywood > Harrisburg (Hershey, Knoebels) andf finshing with NYC Luna Park.

The only two parks planned I skipped were Dorney (torrential rain) and Indiana Beach (closed due to tornado warning)
 
Yess I love it when everyone gets their charts out, here's mine:
1673649571173.png

My best year in terms of pure numbers is 2019 with 47 new creds, 2022 was my third best which is pretty good going considering I have the little one these days.

However looking at quality as well as quantity, you'd have to say 2022 was my best year ever as I had my first rides on my current #1, #2 and #6 all in quick succession (plus I no longer have to admit to people that I have never been to Florida). My best coasters of 2019 are now sitting at #7, #8 and #9 which is still pretty great but I'm still going to stick with 2022 as the best year yet.
 
For me it probably would have been 2010 because of the two lengthy American lives and the fact that I hadn't been to a lot of the parks that we went to, and then 2016 because I did a month and a half of traveling for both creds and culture. The last few years have really sucked, and I've been stagnating in the 500s for quite some time now due to life and my offspring. Little cred cockblock!

Whenever I get myself back to Europe and do the European parks, that's going to definitely be one of my better years. So much untapped potential there for me!
 
Statistically, 2008 was my best year for new creds with 91, and in a lot of ways, it feels nuts to say that wasn't my best year as I traversed the US and checked off so many major parks including SFMM, Knott's, Disneyland, SFFT, Kings Dominion, SFGAdv, SFNE, and Lake Compounce. However, subjectively, 2016 was what I'd consider to be my best/most successful year. It was simply full of highlights:
  • 72 new creds (third best year)
  • 11 new parks
  • First International Park: Canada's Wonderland
  • First trip to Europe
  • First European funfair: Schuberfouer (Luxembourg City)
  • Rode coasters in 4 new countries: Canada, England, Luxembourg, Germany
  • 5 new-for-2016 coasters including Taron, Mako, and Storm Chaser
  • Numerous High Profile/Bucket List Parks: Alton Towers, Europa Park, Holiday Park, Phantasialand, Canada's Wonderland
  • Numerous High Profile/Bucket List Coasters: Nemesis, Smiler, Blue Fire, Wodan, Expedition GeForce, Great Escape Comet, Wicked Cyclone, I305, SkyRush, Leviathan, Flying Turns, Black Mamba
The combination of riding some significant domestic coasters along with the first taste of Europe just really set the year apart. There is something so different and special about visiting parks in Europe. I suppose part of it might be a bit of "the grass is always greener" effect, but I truly feel that the parks are generally nicer and provide a better experience.
 
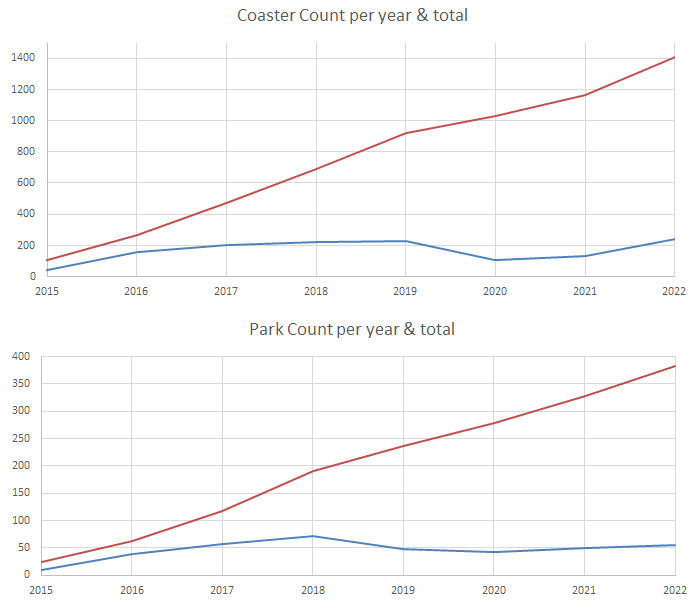
Most New Coasters Ridden

#1 2022 = 242
#2 2019 = 230
#3 2018 = 223

Yup, last year was the biggest year yet and continued the steady climb of a trend that had been going on ever since I started taking this thing (somewhat) seriously.
It's mostly thanks to the mega US road trip, on which we racked up a ridiculous 160 creds, though it would be rude not to mention Florida and... Old Macdonalds Farm or something.
I'm in the midst of a mid-goon crisis right now though, because this obviously has to peak at some point. Has it already happened?

Most New Parks Visited

#1 2018 = 72
#2 2017 = 56
#3 2022 = 55

This one seems to have peaked long ago though, perhaps inherently through being the earlier days, when of course every park is still new to you.
Over the years new coasters pop up and you end up spending a bigger proportion of the time revisiting the same old classics (ugh, so much Phantasialand), but I can't really pinpoint why 2018 happened like that. It's a silly number.

Number of Theme Park Days

#1 2018 = 64
#2 2017 = 52
#3 2022 = 48

Luckily this one pinpoints it for me. I guess it's obvious if you spend more time theme parking then you'll visit more parks. And so it becomes clear that I already peaked way back in 2018. Crisis averted, I'm still going strong.
I also prefer this measure the most, because what carries more weight than the amount of time spent doing what you love?

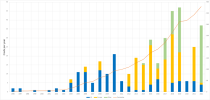
Have a graph or three:

2022-summary.png


1673877978762.png
 
Two years really made waves:

2007: 68 creds
2022: 78 creds

2022 was the most I've travelled in my entire life, with 6 different major trips, including a 2 week long adventure in Europe.
 
2022 for sure. Managed to visit 11 different parks (Florida & UK) and get plenty of new creds including my first RMC and Intamin multi-launch (which of course took the top spots in my rankings)

2023 is looking to be an interesting one....whilst not as many parks as last year, I'll visiting new ones across Europe and one of the parks I'll be doing is a solo trip which will be a massive stepping stone for me!
 
2022.

I became an enthusiast in 2020 due to the pandemic (too much time watching yt "Top 10 coasters" videos), but I wasn't able to travel until december 2021. That month I rode 8 new coasters in Phantasialand, and in 2022 I was only able to visit Gardaland (8 coasters) and Hyde Park's Winter Wonderland (2 coasters).

I'm hoping to ride at least 23 new coasters in 2023... We'll see how that goes!
 
Hi guys. With 2023 having recently started and 2022 having recently ended, there have been a lot of "2022 year in review" type threads around the internet for us to be able to talk about how good 2022 was for us. However, that might not reflect your most successful year as an enthusiast, so I'd be keen to know; of all the years you've been a theme park enthusiast, which would you say was your most successful? What year would you say you were most pleased with in terms of things you accomplished, or the number of new creds you rode, or the number of park days you had?

I'll get the ball rolling with my answer.

I could answer this question from the heart and talk about my own opinion of which year was most successful, but I thought it would be far more fun to try and answer it using various different statistics! There are so many different metrics by which you could determine a "successful" year, so I thought I'd try and explore a number of different coaster and park related statistics from my own enthusiast journey to see which years were best for me through different metrics...
Most New Coasters Ridden
Let's start with an obvious one; the number of new coasters I rode in a year! The top 3 years where I rode the most new coasters are as follows:
RankingYearNew Coasters Ridden
12014 and 201817
2201613
3202212
So by that metric, 2014 and 2018 are joint highest as my most successful year for new coasters, with a solid +17 being gained in both years! 2014 was a higher proportional gain to the count, as my 2013 count was vastly smaller than my 2017 count, but the raw gain is the same.

Most New Parks Visited
I might as well examine how many new parks I visited in each year too! The top 3 years where I visited the most new parks were as follows:
RankingYearNew Parks Visited
12014 and 20195
220163
320182
By that metric, 2014 and 2019 are joint highest as my most successful year for new parks, with a +5 being added to the park count in both years! As above, 2014 was a higher proportional gain due to my park count being smaller back then, but the raw gain is the same as it was in 2019.

Number of Coaster Rides
Riding new coasters is brilliant, but I'd argue that overall coaster rides could also be used as a success metric in itself! The top 3 years where I had the most coaster rides were as follows:
RankingYearOverall Coaster Rides
1202291
2202160
3201946
Interestingly, 2022, with 91 coaster rides having been taken, won the coaster ride stakes by an absolute landslide, beating out the 2nd place year by over 50%! Given that 2021 came second and 2019 came third, I'm clearly getting gradually better at riding lots of coasters in a year!

Number of Theme Park Days
It's not all about the coaster rides, so you could also use your total theme park days as a success metric! The top 3 years where I had the most theme park days were as follows:
RankingYearOverall Theme Park Days
1201914
2201611
32014 and 20229
2019 was the year with the highest number of theme park days for me, with 2 weeks having been spent in theme parks in total that year!

Number of Unique Coasters Ridden
Having lots of coaster rides in a year is all well and good, but if loads of those are just you lapping a few rides over and over, that doesn't offer a lot of variety, does it? With that in mind, I reckon the number of unique coasters ridden could be another good success metric! The top 3 years where I rode the most unique coasters were as follows:
RankingYearUnique Coasters Ridden
1201932
2202229
3201626
2019 was the year where I rode the most different coasters, with 32 different coasters having been ridden in total!

Number of Unique Parks Visited
Spending loads of days at theme parks is all well and good, but if 90% of those days are just you visiting Alton Towers over and over again, that's not a very diverse visitation range. As such, I think that the number of unique parks visited could be a good success metric! The top 3 years where I visited the most unique parks were as follows:
RankingYearUnique Parks Visited
1201910
22014 and 20166
32018, 2021 and 20224
2019 was the year where I visited the most different theme parks, with 10 different theme parks having been visited in total!

So overall, I think I can ascertain that 2019 has probably been my most successful year so far, seeing as it topped many of the success metrics and appeared in the top 3 for the vast majority of them! There are all kinds of ways you could measure success, but of the ones I used, 2019 seems to come out on top.

But which year has been your most successful since you became an enthusiast? Whether you answer from the heart or take a more statistical route like I did, I'd be really keen to know!
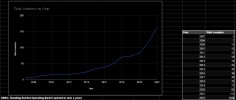
Following the update of another of my threads earlier in the day, about “most times you’ve ridden a specific attraction in one day”, I thought it might be fun to update this thread!

Since I last posted in here, I scrapped my “enthusiasm start date” and explored my exhaustive theme park visiting history rather than simply starting from 2013. This retcon did change some of these stats, and also allowed me to delve into more specificity with regard to some of the earlier years. This is also why the stats for some years have changed compared to my previous posts.

Let’s break the updated stats down, KPI by KPI…
Number of New Coasters Ridden
RankingYearNumber of New Coasters Ridden
1202423
2202317
3201815

Number of New Parks Visited
RankingYearNumber of New Parks Visited
12012 and 20245
220194
320093

Number of Coaster Rides
RankingYearNumber of Coaster Rides
12024101
2202291
3202377

Number of Park Visits
RankingYearNumber of Park Visits
1202316
22019 and 202414
32014 and 201611

Number of Unique Coasters Ridden
RankingYearNumber of Unique Coasters Ridden
1202341
2202440
3201932

Number of Unique Parks Visited
RankingYearNumber of Unique Parks Visited
1201910
22023 and 20249
32012, 2014 and 20166

With this in mind, I think it's safe to say that 2023 and 2024 have now been my most successful years so far! Both years appear in the top 3 for all KPIs, and at least one of them tops most KPIs, with the other usually not far behind!
 
Top