JoshC.
Strata Poster
I'm sure I've posted some of these somewhere on here before, but this seems like a good thread to do it too, and chat about what I have planned with my Cred Sheet...
So we've got the classic Creds by Year chart:

Chart of countries:

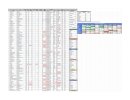
And here's the corresponding table, in numerical order:
Creds by their listed scale on rcdb:

I find it interesting that the Thrill category lags behind Extreme and Family so much.
A less interesting one of Wood vs Steel:

I don't include hybrids; I put them in one or the other. I had a reason for that, but I cannot remember why.
A quirkier one I started tracking last year; Direction of Creds:

Requires a bit of explanation:
"Forwards" and "Backwards" are self explanatory: coasters where they are either entirely forwards or backwards respectively
"Swing" is for coasters featuring a swing launch, and this being their only means of changing direction (eg: Toutatis)
"Mixed" is for coasters featuring both forwards and backwards directions, but not (just) from a swing launch (eg Thirteen). This currently includes Boomerang coasters, but I'm going to put them in a separate category
"Both" is for coasters which have had trains/cars/rows which have run entirely forwards and entirely backwards, and I've ridden both as such (eg: Swarm)
"Other" is for spinning and 4D coasters
Another quirkier one, creds by whether they're indoors or outdoors:

Again, for further explanation:
"Mixed (I)" is for coasters which are primarily indoors, but have a little outdoor section (eg: Huracan at Bellewaerde)
"Mixed (O)" is for coasters which are primarily outdoors, but have a little indoor section (eg: Saw)
The yellow sliver is "Mixed", which is for coasters which are 50/50 (roughly) indoors and outdoors. I only have two here: Vliegende Hollander and Turbo Track.
Next we have a breakdown of inversion:


And doing this has made me realise I rode my 100th inverting cred yesterday...Generator at Walibi RA. Yay?
And finally on the charts, the breakdown by length/height/speed:


I find these unsatisfying given the large number number of unknowns. I could spend more time finding out missing numbers, or putting in approximates to put them in ranges. Something for the future.
Now for stuff I don't have in charts:
Table using the 'Design' criteria on rcdb:
Numbers didn't make it seem worthwhile to put it into a chart.
It's a similar scenario for the 'Category' criteria:
I'll stick this one in spoilers, for obvious reasons, but my table of manufacturers (look at me finally addressing the topic at hand)...
Now, something which is a work in progress.
I've kept a track of my end of year rankings since 2021. So, for example, I have a table with 143 coasters I ranked at the end of 2021. I have a similar one for end of 2022 and 2023. I currently have 257 coasters ranked in my 2024 sheet.
My hope is to be able to compare how I've ranked coasters throughout the years. For example, at the end of 2021, I had Lech Coaster ranked as my #14. Currently, it is ranked as my #40.
But, given I've ranked over 100 more coasters, how differently ranked is Lech in my standings now?
I currently have a sheet doing this in a crude way, doing "1 - [year rank] / [number of coasters ranked]". This gives the coaster a score between 0 and 1 each year, with the higher the score, the better it is in proportion with the coasters I've ranked. Here's Lech for 2021-2024:

So, for example, in 2021, Lech was ranked 14th and around the Top 10%, with a score of 0.901. Each year, it's slipped down the ranking (because I've ridden more coasters that I've liked more), and it's score has dropped.
I don't know what I can really do with this, whether it's any use, or what, but just something I've got in the background.
Other things I track on my Cred Sheet, but don't do much with:
So we've got the classic Creds by Year chart:
Chart of countries:
And here's the corresponding table, in numerical order:
| Country | Number of Creds |
|---|---|
| UK | 92 |
| France | 39 |
| Germany | 39 |
| USA | 38 |
| Netherlands | 33 |
| Belgium | 32 |
| Denmark | 32 |
| Spain | 24 |
| UAE | 23 |
| Poland | 15 |
| Finland | 8 |
| Norway | 7 |
| Ireland | 6 |
| Sweden | 5 |
Creds by their listed scale on rcdb:
I find it interesting that the Thrill category lags behind Extreme and Family so much.
A less interesting one of Wood vs Steel:
I don't include hybrids; I put them in one or the other. I had a reason for that, but I cannot remember why.
A quirkier one I started tracking last year; Direction of Creds:
Requires a bit of explanation:
"Forwards" and "Backwards" are self explanatory: coasters where they are either entirely forwards or backwards respectively
"Swing" is for coasters featuring a swing launch, and this being their only means of changing direction (eg: Toutatis)
"Mixed" is for coasters featuring both forwards and backwards directions, but not (just) from a swing launch (eg Thirteen). This currently includes Boomerang coasters, but I'm going to put them in a separate category
"Both" is for coasters which have had trains/cars/rows which have run entirely forwards and entirely backwards, and I've ridden both as such (eg: Swarm)
"Other" is for spinning and 4D coasters
Another quirkier one, creds by whether they're indoors or outdoors:
Again, for further explanation:
"Mixed (I)" is for coasters which are primarily indoors, but have a little outdoor section (eg: Huracan at Bellewaerde)
"Mixed (O)" is for coasters which are primarily outdoors, but have a little indoor section (eg: Saw)
The yellow sliver is "Mixed", which is for coasters which are 50/50 (roughly) indoors and outdoors. I only have two here: Vliegende Hollander and Turbo Track.
Next we have a breakdown of inversion:
And doing this has made me realise I rode my 100th inverting cred yesterday...Generator at Walibi RA. Yay?
And finally on the charts, the breakdown by length/height/speed:
I find these unsatisfying given the large number number of unknowns. I could spend more time finding out missing numbers, or putting in approximates to put them in ranges. Something for the future.
Now for stuff I don't have in charts:
Table using the 'Design' criteria on rcdb:
| Design | Number of Creds |
|---|---|
| Sit Down | 337 |
| Inverted | 25 |
| Suspended | 11 |
| Wing | 10 |
| Bobsled | 4 |
| Flying | 4 |
| Stand Up | 2 |
| Pipeline | 0 |
It's a similar scenario for the 'Category' criteria:
| Category | Number of Creds |
|---|---|
| Lift | 263 |
| Spinning | 41 |
| Launch | 35 |
| Powered | 15 |
| Shuttle | 13 |
| Floorless | 6 |
| Water | 5 |
| 4D | 3 |
| Alpine | 3 |
| Motorbike | 3 |
| Brakeman | 2 |
| Mobius | 2 |
| Single Rail | 2 |
| Hamster Wheel | 0 |
I'll stick this one in spoilers, for obvious reasons, but my table of manufacturers (look at me finally addressing the topic at hand)...
| Manufacturer | Number of Creds |
|---|---|
| Vekoma | 65 |
| Intamin | 39 |
| Mack | 38 |
| Zierer | 34 |
| Gerstlauer | 29 |
| B&M | 25 |
| Zamperla | 22 |
| Maurer | 20 |
| Unlisted / Unknown | 14 |
| SBF | 13 |
| GCI | 9 |
| Pinfari | 8 |
| Reverchon | 8 |
| Arrow | 7 |
| Soquet | 7 |
| CCI | 5 |
| Schwarzkopf | 5 |
| Philadelphia Toboggan Coasters | 4 |
| Preston&Babieri | 4 |
| S&S | 4 |
| Gravity Group | 3 |
| WGH Transportation | 3 |
| Wiegand | 3 |
| Caripro | 2 |
| L&T Systems | 2 |
| RCCA | 2 |
| RMC | 2 |
| abc | 1 |
| ART Engineering | 1 |
| Cavazza Diego | 1 |
| DAL | 1 |
| DH Morgan Manufacturing | 1 |
| Dynamic Attractions | 1 |
| E&F Miler Industries | 1 |
| Fabbri | 1 |
| Gosetto | 1 |
| Güven Amusement Rides Factory | 1 |
| I.E. Park | 1 |
| KumbaK | 1 |
| Meridian Ltd. | 1 |
| Pax | 1 |
| Sartori Rides | 1 |
| Wisdom Rides | 1 |
Now, something which is a work in progress.
I've kept a track of my end of year rankings since 2021. So, for example, I have a table with 143 coasters I ranked at the end of 2021. I have a similar one for end of 2022 and 2023. I currently have 257 coasters ranked in my 2024 sheet.
My hope is to be able to compare how I've ranked coasters throughout the years. For example, at the end of 2021, I had Lech Coaster ranked as my #14. Currently, it is ranked as my #40.
But, given I've ranked over 100 more coasters, how differently ranked is Lech in my standings now?
I currently have a sheet doing this in a crude way, doing "1 - [year rank] / [number of coasters ranked]". This gives the coaster a score between 0 and 1 each year, with the higher the score, the better it is in proportion with the coasters I've ranked. Here's Lech for 2021-2024:
So, for example, in 2021, Lech was ranked 14th and around the Top 10%, with a score of 0.901. Each year, it's slipped down the ranking (because I've ridden more coasters that I've liked more), and it's score has dropped.
I don't know what I can really do with this, whether it's any use, or what, but just something I've got in the background.
Other things I track on my Cred Sheet, but don't do much with:
- Opening date of each coaster
- Year last ridden
- Age of coaster when first ridden (mean average at the mo: 14.26 years old)
- Age of coaster when last ridden (mean average at the mo: 15.44 years old)
- English translation of name, where appropriate (for example, I wouldn't translate "El Toro" to "The Bull", but I would translate "Drachen" to "Dragon")
- Times ridden (not perfect for some of my home parks coasters, but good enough for most)
")