As a quick forward, appreciate everyone's patience for waiting for this year's Top 10 coaster rankings! Reading through will explain some of the delay, and fun new insights we will be bringing.
2024 has come and gone, and with it @Pokemaniac returned back to the Top 10 thread to wrangle and report collective rankings across all members who have posted over the subsequent year. 63 CFers shared posts throughout the year, keeping a good, consistent stream of rankings through the years. On behalf of @Pokemaniac, @Hixee , and the entire CF Team, may I present the latest edition of the Top 10 Roller Coasters of CoasterForce!
Methodology
One of the most visited threads in the General Discussions section of the forums is the "Top 10-ish" thread, where people rank their ten (or more) most favourite coasters. We have combed through the thread and collected all the Top 10 lists posted over the past year. Let us compare details on CF's top 25!
The Top 25
Key Thoughts/Takeaways
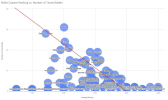
As usual, we’ve created a few graphs to provide further insights into CFers’ top roller coasters. You can view the complete spreadsheet with all the graphs at the end of this post. Here’s a chart that illustrates the average roller coaster ranking compared to the number of rides. The higher a roller coaster is positioned towards the upper left corner, the higher it is in the ranking. I’ve also added a trend line to enhance the visualization.


View attachment 35749

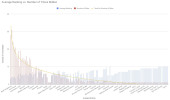
View attachment 35750
Analyzing the average roller coaster rankings based on the number of rides reveals a strong correlation with their overall ranking. Steel Vengeance continues to be the undisputed champion in every category we examine!
Year-Over-Year Trends
For year-over-year, I highlighted a few key observations above. Some other good takeaways:
Sample Size Matters
As before, the poll’s reliability heavily relies on the sample size and the responses participants provide for their top 10 rankings. If you believe a roller coaster was unjustly excluded this year, kindly share your top 10 rankings in the thread so we can include them in next year’s count!
Additionally, we’ve updated the alternate rankings, similar to last year, to showcase various methods for measuring roller coaster rankings. For instance, we’re now recording results to account for strong outliers and eliminating the top and bottom-most votes for each roller coaster as a control measure for outlier votes.
Comparing to Other Polls
We appreciate @coasterbot continuous efforts in providing new annual rankings (https://coasterbot.com/votecoasters), which we’ve included as a final comparison. Nevertheless, the rankings are still quite close to each other. Is there something substantial that CoasterForce is uncovering? It’s fascinating to observe that, despite employing two different polling methodologies, a consistent overall trend emerges. (This phenomenon is partly attributed to the sample size.)
Check Out the Full Rankings!
You can peruse all the data and tables here: https://docs.google.com/spreadsheets/d/1UjvpxIP88k2YTdoFL-x8XbnMVfNehbuK0AjWol0tiuo/edit?usp=sharing
The End?
You may notice that some roller coasters have different average rankings compared to their average rankings per ride. If we were to solely consider the average rank, we would get a different result. Nevertheless, we still prefer to take into account the number of rides to ensure that the rankings accurately reflect the preferences of the entire community rather than a select group of individuals.
... But what would you say if we did try to create a different way to rank and order roller coaster Top 10s, and the results were, well, interesting to say the least?
This was part of the delay for releasing this year's CoasterForce Top 10 (we typically wrap and capture all top 10's at the end of December for a given year) - while we had some fun new ideas, such as applying an ELO model to improve ranking comparisons, or even consider Baysian, TrueSkill, or PageRank algorithms we also discovered some underlying flaws/considerations to how roller coaster rankings work and the assumptions needed to make roller coaster ranking data usable.
And so, we'll conclude this Part 1 of CoasterForce Top 10, and tag back in a few weeks' time (already behind to get this part out!) with a first ever Part 2, that is designed to delve more into roller coaster ranking systems, and how roller coaster data does and doesn't work.
Did we discover a massive government conspiracy? Did we find Leviathan is actually the best ranked Giga? Is Lightning Rod better with the chainlift? Check back to find out!
2024 has come and gone, and with it @Pokemaniac returned back to the Top 10 thread to wrangle and report collective rankings across all members who have posted over the subsequent year. 63 CFers shared posts throughout the year, keeping a good, consistent stream of rankings through the years. On behalf of @Pokemaniac, @Hixee , and the entire CF Team, may I present the latest edition of the Top 10 Roller Coasters of CoasterForce!
Methodology
One of the most visited threads in the General Discussions section of the forums is the "Top 10-ish" thread, where people rank their ten (or more) most favourite coasters. We have combed through the thread and collected all the Top 10 lists posted over the past year. Let us compare details on CF's top 25!
The Top 25
| Rank | Roller Coaster | Average Ranking | Average Ranking/Frequency | Number of #1 Rankings | Number of Rides |
| 1 | Steel Vengeance | 2.86 | 0.1 | 13 | 28 |
| 2 | Zadra | 4.03 | 0.13 | 7 | 31 |
| 3 | Taron | 4.08 | 0.17 | 2 | 24 |
| 4 | Ride To Happiness | 3.8 | 0.19 | 3 | 20 |
| 5 | Iron Gwazi | 4.33 | 0.21 | 4 | 21 |
| 6 | Velocicoaster | 3.44 | 0.22 | 4 | 16 |
| 7 | Voyage | 4.4 | 0.29 | 1 | 15 |
| 8 | Helix | 5.68 | 0.3 | 3 | 19 |
| 9 | Intimidator 305 | 3.2 | 0.32 | 2 | 10 |
| 10 | Fury 325 | 6.16 | 0.32 | 0 | 19 |
| 11 | Hyperion | 4.79 | 0.34 | 1 | 14 |
| 12 | Untamed | 5.4 | 0.36 | 2 | 15 |
| 13 | Skyrush | 5.14 | 0.37 | 1 | 14 |
| 14 | Toutatis | 5.21 | 0.37 | 1 | 14 |
| 15 | Shambhala | 6 | 0.38 | 1 | 16 |
| 16 | ArieForce One | 5.38 | 0.41 | 1 | 13 |
| 17 | Wildcat's Revenge | 4.64 | 0.42 | 0 | 11 |
| 18 | Kondaa | 6.33 | 0.42 | 0 | 15 |
| 19 | Lightning Rod | 6.14 | 0.44 | 1 | 14 |
| 20 | Maverick | 5.7 | 0.57 | 1 | 10 |
| 21 | Voltron | 4.29 | 0.61 | 2 | 7 |
| 22 | Batman Gotham City Escape | 5.67 | 0.63 | 0 | 9 |
| 23 | El Toro | 5.78 | 0.64 | 0 | 9 |
| 24 | Hyperia | 6.7 | 0.67 | 1 | 10 |
| 25 | Eejanaika | 3 | 0.75 | 1 | 4 |
Key Thoughts/Takeaways
- Ride to Happiness experienced a remarkable surge in rankings, climbing up 4 spots to secure the fourth position overall. This trend aligns with other roller coaster polls that witnessed similar improvements. It’s thrilling to witness the ride’s growing popularity as more people get to experience it!
- RMC Continues to Dominate - Steel Vengeance and Zadra remain an unstoppable one-two punch for rankings.
- It’s Challenging to Introduce New Coasters - Overall, we witnessed a rather weak performance from new coasters in 2024 (none managed to secure a spot in the top 20), and only three 2023 coasters (Wildcat’s Revenge, ArieForce One, and Batman Gotham City Escape) managed to maintain their position in the top 25. This can be attributed to the continued pilgrimage of thrill-seekers to these rides, which is further reinforced by the fact that these coasters are receiving an earnest boost as their ridership increases. As we eagerly anticipate the addition of some major new coasters in 2025 (Falcon’s Flight, Epic Universe coasters, and Transformers coaster, among others), we may face a potential challenge in not being able to witness new contenders for a period of time.
- Intimidator 305 Nostalgia? Apparently, many thrill-seekers wanted to make their final rides on Intimidator, or Project 305, or even Pantherian! The 2010 Intamin Giga proved that it still delivers an exhilarating experience and saw a significant jump to the ninth position overall. It will be interesting to see if this momentum continues or if it indicates more thrill-seekers visiting Kings Dominion.
- What Do You Guys Know That I Don’t? - We observed a steady stream of popular hits, with some roller coasters experiencing a previous surge in popularity (Phantom’s Revenge, for example, was on a hot streak that propelled it up to the 23rd position) only to completely fall out of favor this year.
- The Great Demise of Lightning Rod - remember when we were wondering if Lightning Rod's lift hill fix would not only improve operations, but make it a once-again top 3 coaster? (It topped out at #2 overall on our rankings) Alas, the tragic coaster now ranks at #19 with the new, chained lift hill. Unfortunately, operations improvement came at the cost of greatness.
As usual, we’ve created a few graphs to provide further insights into CFers’ top roller coasters. You can view the complete spreadsheet with all the graphs at the end of this post. Here’s a chart that illustrates the average roller coaster ranking compared to the number of rides. The higher a roller coaster is positioned towards the upper left corner, the higher it is in the ranking. I’ve also added a trend line to enhance the visualization.


View attachment 35749

View attachment 35750
Analyzing the average roller coaster rankings based on the number of rides reveals a strong correlation with their overall ranking. Steel Vengeance continues to be the undisputed champion in every category we examine!
Year-Over-Year Trends
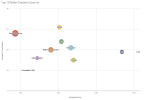
For year-over-year, I highlighted a few key observations above. Some other good takeaways:
- Taron and Zadra flip-flopped this year in spots - it remains such a tight race in the top three!
- Speaking of tight Intamin/RMC races, the Florida coasters (Iron Gwazi and Velocicoaster) equally parked next to each other, with an average ranking of 6.0 each at this point.
- New for 2024 coasters were not in “major” markets as much this year - Voltron, Batman Gotham City Escape, and Hyperia all debuted at 21, 22, and 24 respectively. Expect to see these coasters rise as more enthusiasts get their rides in.
- A lot of tumbling and turning amongst rankings is usually indicative of turnout and submitted ballots. Reasons why it’s always good to be sure you re-up your top 10 rankings year-over-year!
| Roller Coaster | 2018 | 2019 | 2020 | 2021 | 2022 | 2023 | 2024 | Change From Previous Year | Average Ranking |
| Steel Vengeance | 1 | 1 | 1 | 1 | 1 | 1 | 1 | 0 | 1 |
| Zadra | - | 16 | 6 | 2 | 2 | 3 | 2 | 1 | 5.2 |
| Taron | 3 | 2 | 2 | 3 | 4 | 2 | 3 | -1 | 2.7 |
| Ride to Happiness | - | - | - | 4 | 6 | 8 | 4 | 4 | 5.5 |
| Iron Gwazi | - | - | - | 5 | 9 | 5 | 5 | 0 | 6 |
| Velocicoaster | - | - | - | 6 | 8 | 4 | 6 | -2 | 6 |
| Voyage | 8 | 5 | 7 | 7 | 3 | 6 | 7 | -1 | 6.1 |
| Helix | 7 | 2 | 5 | 8 | 7 | 9 | 8 | 1 | 6.6 |
| Intimidator 305 | 25 | 15 | 35 | 9 | 12 | 16 | 9 | 7 | 17.3 |
| Fury 325 | 11 | 9 | 10 | 10 | 11 | 11 | 10 | 1 | 10.3 |
| Hyperion | 58 | 19 | 18 | 11 | 17 | 26 | 11 | 15 | 22.9 |
| Untamed | - | 8 | 9 | 12 | 14 | 12 | 12 | 0 | 11.2 |
| Skyrush | 4 | 6 | 4 | 13 | 5 | 7 | 13 | -6 | 7.4 |
| Toutatis | - | - | - | 14 | - | 37 | 14 | 23 | 21.7 |
| Shambhala | 14 | 16 | 8 | 15 | 15 | 10 | 15 | -5 | 13.3 |
| ArieForce One | - | - | - | 16 | - | 19 | 16 | 3 | 17 |
| Wildcat's Revenge | - | - | - | 17 | - | 44 | 17 | 27 | 26 |
| Kondaa | - | - | - | 18 | 28 | 14 | 18 | -4 | 19.5 |
| Lightning Rod | 2 | 4 | 3 | 19 | 10 | 13 | 19 | -6 | 10 |
| Maverick | 4 | 10 | 11 | 20 | 13 | 15 | 20 | -5 | 13.3 |
| Voltron | - | - | - | 21 | - | - | 21 | - | 21 |
| Batman Gotham City Escape | - | - | - | 22 | - | - | 22 | - | 22 |
| El Toro | 10 | 7 | 12 | 23 | 16 | 17 | 23 | -6 | 15.4 |
| Hyperia | - | - | - | 24 | - | - | 24 | - | 24 |
| Eejanaika | 32 | 106 | 34 | 25 | 118 | 57 | 25 | 32 | 56.7 |
Sample Size Matters
As before, the poll’s reliability heavily relies on the sample size and the responses participants provide for their top 10 rankings. If you believe a roller coaster was unjustly excluded this year, kindly share your top 10 rankings in the thread so we can include them in next year’s count!
Additionally, we’ve updated the alternate rankings, similar to last year, to showcase various methods for measuring roller coaster rankings. For instance, we’re now recording results to account for strong outliers and eliminating the top and bottom-most votes for each roller coaster as a control measure for outlier votes.
Comparing to Other Polls
We appreciate @coasterbot continuous efforts in providing new annual rankings (https://coasterbot.com/votecoasters), which we’ve included as a final comparison. Nevertheless, the rankings are still quite close to each other. Is there something substantial that CoasterForce is uncovering?
Check Out the Full Rankings!
You can peruse all the data and tables here: https://docs.google.com/spreadsheets/d/1UjvpxIP88k2YTdoFL-x8XbnMVfNehbuK0AjWol0tiuo/edit?usp=sharing
The End?
You may notice that some roller coasters have different average rankings compared to their average rankings per ride. If we were to solely consider the average rank, we would get a different result. Nevertheless, we still prefer to take into account the number of rides to ensure that the rankings accurately reflect the preferences of the entire community rather than a select group of individuals.
... But what would you say if we did try to create a different way to rank and order roller coaster Top 10s, and the results were, well, interesting to say the least?
This was part of the delay for releasing this year's CoasterForce Top 10 (we typically wrap and capture all top 10's at the end of December for a given year) - while we had some fun new ideas, such as applying an ELO model to improve ranking comparisons, or even consider Baysian, TrueSkill, or PageRank algorithms we also discovered some underlying flaws/considerations to how roller coaster rankings work and the assumptions needed to make roller coaster ranking data usable.
And so, we'll conclude this Part 1 of CoasterForce Top 10, and tag back in a few weeks' time (already behind to get this part out!) with a first ever Part 2, that is designed to delve more into roller coaster ranking systems, and how roller coaster data does and doesn't work.
Did we discover a massive government conspiracy? Did we find Leviathan is actually the best ranked Giga? Is Lightning Rod better with the chainlift? Check back to find out!
