
Matt N
CF Legend
Disclaimer: This post is extremely long, and if you don't like data analysis and geeky maths talk, I'd suggest you run for the hills and don't look back, because this post has quite a bit of it!
Hi guys. Some of you might remember that I recently did a multi-part data analysis investigation on Europe's major coaster selections (topic is here if you don't know what I'm on about: https://coasterforce.com/forums/thr...part-3-quantoverqual-and-qualoverquant.45455/), where I asked numerous different questions about Europe's major coaster selections. So I thought that a natural next step would be to try North America; it would be rude of me not to pay the Americans a visit given how many coasters and parks are in the USA alone, let alone the rest of North America!
But for those of you who have no idea about my previous data analysis investigation, let me just introduce what I'm doing...
Introduction
There are a lot of theme parks in North America, as well as a lot of roller coasters. So naturally, people (myself included) tend to ask questions like “which park has North America’s best roller coaster lineup?” or “which parks are quality-over-quantity and which parks are quantity-over-quality?”, amongst others. As such, while it’s not really a discussion thread as such, I thought it might be fun to try to take a quantitative look into some of these questions and try to answer them using some data science techniques. So join me as I attempt to perform a quantitative, multi-part analysis of North America’s major coaster selections! I'll split my investigations into a couple of posts, one for each question, to make it a little more digestible.
Before we start, let me set out a few prerequisites and explain some of the facts regarding the investigation…
Prerequisites of the Investigation
The Dataset
When searching through RCDB for theme parks that met my criteria, as well as cross-referencing with Captain Coaster to ensure that the criteria were met in terms of scoreability, I found 41 theme parks with 358 roller coasters between them. These parks, as well as the number of scoreable roller coasters they each contain, are as follows:
Let's move on to some fun stuff now... I'll start analysing some different common questions and see what answers I come out with. I'll use this first post to do...
What is North America’s most consistently strong coaster selection?
Yes, I’ll be finding out which coaster selection in North America is the most consistently strong! For clarity, this focuses on the entire scoreable selection and sees the consistent strength of a park’s lineup. This is not weighted solely towards a park’s more highly rated coasters (I’ll be examining the top ends of selections on their own in a separate question), but instead considers the consistent strength of a park’s whole selection. I’m basically asking “to what extent does each park in the dataset have a consistently strong, good quality lineup?”.
There are numerous data science techniques we can use to find this out.
Let’s start with the first one…
Mean
The first statistical method we can use is the mean. For those that don’t know, the mean is a calculated average, where the sum of all a park’s coaster ratings is calculated and then divided by the number of scoreable coasters in that park to work out the average rating. The formula for the mean is as follows:
Mean Rating = Sum of all Ratings/Number of Scoreable Coasters
When applying the mean to each park in the dataset, the top 10 most consistently strong coaster selections in North America were as follows:
But mean is not the only statistical measure I can use…
Median
Another statistical measure we can use is the median. For those that don’t know, the median is the middle value in a dataset; the midpoint, if you like. For instance, in a dataset of 9 scoreable roller coasters, the median value would be the 5th highest rated coaster, because there are 4 coasters rated higher than it and 4 coasters rated lower than it.
When applying the median to each park in the dataset, the top 10 most consistently strong coaster selections in North America were as follows:
However, there’s one final statistical measure of my own that I’d like to test out…
The Matt N Formula for Consistent Strength
So far, I have used two pre-existing statistical measures; the mean, a calculated average, and the median, the midpoint value. However, each of these has its own flaws and things that it doesn’t really consider.
The mean is flawed in that it can be quite easily skewed by a small number of data items on the extreme ends of the spectrum, thus not providing an accurate picture of the whole selection. Whereas the median, while possibly providing a more accurate picture of the general quality of a selection, does not take the extreme ends of the spectrum into account at all; if a park's coaster selection had a median rating of 6/10, the top value could be a 7/10 or a 10/10 and it would make no difference.
With that in mind, I decided to come up with my own formula to determine the consistent strength of a selection. A formula that takes into account both the extreme ends of the spectrum and the general quality across the board. So let me present The Matt N Formula for Consistent Strength; the formula is as follows:
Matt N Formula for Consistent Strength = (Highest rating + Upper quartile)*(Lowest rating + Lower quartile)
I included the highest rating and the lowest rating to take into account the extreme ends of a selection, while I also integrated quartiles to provide a stronger picture of general quality throughout a selection.
Those of you who followed my Europe data analysis might remember that I initially attempted to use this formula to work out strength in general without really quantifying what strength was, but I later decided that this particular formula would work better to determine consistent strength.
When I applied the Matt N Formula for Consistent Strength to each park in the dataset, the top 10 most consistently strong coaster selections in North America were as follows:
Let’s now summarise what we’ve learned…
Summary
So, what did we learn from this investigation?
Well, while the methods used did differ the results somewhat, there were some names that universally appeared in the top 10 regardless. And there was one park in particular that did shine, scoring highly on all 3 measures.
As it came top when using 2 of the 3 measures and came second in the measure that it didn’t win, I am saying that my data concludes that Silver Dollar City has North America’s most consistently strong coaster lineup. When a park comes out on top 2 out of 3 times and comes second the 3rd time (and a very close second, at that), it’s hard not to declare it the winner!
I’m aware that the results might not be what some expect, and in some ways, they weren’t what I would have expected either, but it is worth me reiterating that this is asking what North America’s most consistently strong coaster lineup is rather than what the strongest coaster lineup is in terms of the park’s highest rated coasters. If I honed in exclusively on each park’s strongest rated coasters (which I will do in a separate question), I can sense these results would look very different.
Also, just because my algorithm is saying that Silver Dollar City wins this, that’s not “the correct answer” by any means; it’s all down to personal opinion. The answer I’m showing here is merely the conclusion that my data analysis came to based off of the average opinions of a subset of coaster enthusiasts.
Just for reference, here is a box plot I created using Python’s MatPlotLib library to show the spread of ratings for each coaster selection and how they compare to one another in a visual way:

I’m aware that that’s a bit of a mess, so just for some idea, here is the order in which the parks appear, from left to right (the number at the side is the number of scoreable coasters the park has:
 docs.google.com
Thanks for reading part 1 of my analysis of North America’s major coaster selections! I’m hoping part 2 will be on its way before too long, and in that one, I’m planning to dive a bit deeper into the top end of these parks’ coaster selections, to see which parks have the strongest top tier; part 1 focused on the selection as a whole, but I know there is a lot of interest in the top tier of these coaster selections in isolation.
docs.google.com
Thanks for reading part 1 of my analysis of North America’s major coaster selections! I’m hoping part 2 will be on its way before too long, and in that one, I’m planning to dive a bit deeper into the top end of these parks’ coaster selections, to see which parks have the strongest top tier; part 1 focused on the selection as a whole, but I know there is a lot of interest in the top tier of these coaster selections in isolation.
But if any of you have any suggestions for questions about this dataset you’d like me to try and answer, then I’m very happy to accept suggestions!
Hi guys. Some of you might remember that I recently did a multi-part data analysis investigation on Europe's major coaster selections (topic is here if you don't know what I'm on about: https://coasterforce.com/forums/thr...part-3-quantoverqual-and-qualoverquant.45455/), where I asked numerous different questions about Europe's major coaster selections. So I thought that a natural next step would be to try North America; it would be rude of me not to pay the Americans a visit given how many coasters and parks are in the USA alone, let alone the rest of North America!
But for those of you who have no idea about my previous data analysis investigation, let me just introduce what I'm doing...
Introduction
There are a lot of theme parks in North America, as well as a lot of roller coasters. So naturally, people (myself included) tend to ask questions like “which park has North America’s best roller coaster lineup?” or “which parks are quality-over-quantity and which parks are quantity-over-quality?”, amongst others. As such, while it’s not really a discussion thread as such, I thought it might be fun to try to take a quantitative look into some of these questions and try to answer them using some data science techniques. So join me as I attempt to perform a quantitative, multi-part analysis of North America’s major coaster selections! I'll split my investigations into a couple of posts, one for each question, to make it a little more digestible.
Before we start, let me set out a few prerequisites and explain some of the facts regarding the investigation…
Prerequisites of the Investigation
- I am using the coaster ratings on Captain Coaster (https://captaincoaster.com/en/) as of May 2022 to perform this investigation. If you look at each ride’s page on CC, it has a % score out of 100; this is what I have used and converted into ratings out of 10. For the rating out of 10 of a ride, I converted the percentage into a rating by dividing by 10 (so for instance, a ride rated 87% would have an average rating of 8.7/10).
- Building upon the ratings stuff; all ratings are rounded to the nearest 0.1 (so to 1dp).
- As a rule of thumb of what’s considered major, I went with; to be considered, a park must have 5 scoreable roller coasters. If you’re wondering why I get so specific in saying “scoreable roller coasters”, it’s because Captain Coaster does not score what it considers to be “kiddie coasters”, so not every ride in a park's lineup is scored. As such, this means that parks with 5 kiddie coasters wouldn't be eligible for this investigation; my rule ensures that a park in the study has 5 family/family thrill coasters, at the very least. It also doesn't score rides where the ridership is too low, but the effect of that upon this investigation is quite minor; only 1 or 2 parks/rides were affected. Off the top of my head, Tumbili at Kings Dominion and Wonder Woman Coaster at Six Flags Mexico (bizarrely given it opened in 2018) are not scored on CC due to their ridership being too low, therefore the investigation excluded them, but all the other new rides that have opened are counted. So the likes of Iron Gwazi, Ice Breaker, Pantheon, VelociCoaster etc are all included.
- However, one inconsistency is that Captain Coaster has a somewhat inconsistent definition of what it considers a kiddie coaster. Using some examples from my home continent of Europe, things like the Steeplechases at Blackpool are considered kiddie coasters, but Blue Flyer in the same park, which I personally would consider a kiddie coaster, isn't. I could have taken kiddie coasters into account, but I could not think of a fair way to do it, as rides that fall into this bracket that slipped through the cracks seem to have wildly varying scores.
- The site also has rides listed on it that some probably wouldn't count as roller coasters, but some do, such as SuperSplash at Plopsaland and Fuga de Atlantide at Gardaland. I just decided to go with the site's scores and the rides that the site scored, as even though I could calculate the mean rating of some unscored rides, I don't think CC's scoring system only uses mean rating, as I seem to remember it being mentioned that members' rankings are also factored in, so me attempting to meddle with CC's system risks introducing bias and skewing the data the wrong way, which you definitely don't want in a data investigation. However, I did think this was something I should raise before we begin.
- The most important prerequisite of all is that the results of this investigation are not necessarily the final answers to the questions I raised in my introductory paragraph by any stretch. All of this still comes entirely down to personal opinion, of course.
The Dataset
When searching through RCDB for theme parks that met my criteria, as well as cross-referencing with Captain Coaster to ensure that the criteria were met in terms of scoreability, I found 41 theme parks with 358 roller coasters between them. These parks, as well as the number of scoreable roller coasters they each contain, are as follows:
- Six Flags Magic Mountain (USA, California): 16
- Canada's Wonderland (Canada): 16
- Cedar Point (USA, Ohio): 16
- Six Flags Great America (USA, Illinois): 14
- Kings Island (USA, Ohio): 14
- Hersheypark (USA, Pennsylvania): 14
- Six Flags Great Adventure (USA, New Jersey): 13
- Carowinds (USA, North Carolina): 13
- Kings Dominion (USA, Virginia): 12
- Six Flags Over Texas (USA, Texas): 11
- Six Flags Over Georgia (USA, Georgia): 10
- Six Flags New England (USA, Massachusetts): 10
- Busch Gardens Tampa (USA, Florida): 10
- Six Flags Fiesta Texas (USA, Texas): 9
- Lagoon (USA, Utah): 9
- Knott's Berry Farm (USA, California): 9
- Six Flags St Louis (USA, Missouri): 9
- Busch Gardens Williamsburg (USA, Virginia): 9
- Six Flags Discovery Kingdom (USA, California): 8
- Six Flags America (USA, Maryland): 8
- La Ronde (Canada): 8
- Dollywood (USA, Tennessee): 8
- Six Flags Mexico (Mexico): 8
- Kennywood (USA, Pennsylvania): 8
- Six Flags Darien Lake (USA, New York): 7
- Valleyfair (USA, Minnesota): 7
- Morey's Piers (USA, New Jersey): 6
- Worlds of Fun (USA, Missouri): 6
- Michigan's Adventure (USA, Michigan): 6
- Silver Dollar City (USA, Missouri): 6
- Dorney Park (USA, Pennsylvania): 6
- SeaWorld Orlando (USA, Florida): 6
- Kentucky Kingdom (USA, Kentucky): 6
- Luna Park (USA, New York): 5
- Indiana Beach (USA, Indiana): 5
- Great Escape (USA, New York): 5
- SeaWorld San Antonio (USA, Texas): 5
- Knoebels (USA, Pennsylvania): 5
- Disney's Magic Kingdom (USA, Florida): 5
- Nickelodeon Universe Theme Park (USA, New Jersey): 5
- Disneyland (USA, California): 5
Let's move on to some fun stuff now... I'll start analysing some different common questions and see what answers I come out with. I'll use this first post to do...
What is North America’s most consistently strong coaster selection?
Yes, I’ll be finding out which coaster selection in North America is the most consistently strong! For clarity, this focuses on the entire scoreable selection and sees the consistent strength of a park’s lineup. This is not weighted solely towards a park’s more highly rated coasters (I’ll be examining the top ends of selections on their own in a separate question), but instead considers the consistent strength of a park’s whole selection. I’m basically asking “to what extent does each park in the dataset have a consistently strong, good quality lineup?”.
There are numerous data science techniques we can use to find this out.
Let’s start with the first one…
Mean
The first statistical method we can use is the mean. For those that don’t know, the mean is a calculated average, where the sum of all a park’s coaster ratings is calculated and then divided by the number of scoreable coasters in that park to work out the average rating. The formula for the mean is as follows:
Mean Rating = Sum of all Ratings/Number of Scoreable Coasters
When applying the mean to each park in the dataset, the top 10 most consistently strong coaster selections in North America were as follows:
| Ranking | Park | Mean (to 1dp) | Number of Scoreable Coasters |
| 1 | Silver Dollar City | 7.5 | 6 |
| 2 | Busch Gardens Williamsburg | 7.3 | 9 |
| 3 | Dollywood | 7.0 | 8 |
| 4 | SeaWorld Orlando | 7.0 | 6 |
| 5 | Cedar Point | 6.6 | 16 |
| 6 | Six Flags Magic Mountain | 6.6 | 16 |
| 7 | Busch Gardens Tampa | 6.5 | 10 |
| 8 | SeaWorld San Antonio | 6.4 | 5 |
| 9 | Six Flags Fiesta Texas | 6.4 | 9 |
| 10 | Kennywood | 6.4 | 8 |
But mean is not the only statistical measure I can use…
Median
Another statistical measure we can use is the median. For those that don’t know, the median is the middle value in a dataset; the midpoint, if you like. For instance, in a dataset of 9 scoreable roller coasters, the median value would be the 5th highest rated coaster, because there are 4 coasters rated higher than it and 4 coasters rated lower than it.
When applying the median to each park in the dataset, the top 10 most consistently strong coaster selections in North America were as follows:
| Ranking | Park | Median (to 1dp) | Amount of Scoreable Coasters |
| 1 | Silver Dollar City | 8.6 | 6 |
| 2 | Busch Gardens Williamsburg | 8.3 | 9 |
| 3 | SeaWorld Orlando | 8.1 | 6 |
| 4 | Busch Gardens Tampa | 7.4 | 10 |
| 5 | Dollywood | 7.3 | 8 |
| 6 | Six Flags Great Adventure | 7.2 | 13 |
| 7 | Cedar Point | 7.2 | 16 |
| 8 | Disney’s Magic Kingdom | 7.0 | 5 |
| 9 | Dorney Park | 7.0 | 6 |
| 10 | Six Flags Magic Mountain | 6.9 | 16 |
However, there’s one final statistical measure of my own that I’d like to test out…
The Matt N Formula for Consistent Strength
So far, I have used two pre-existing statistical measures; the mean, a calculated average, and the median, the midpoint value. However, each of these has its own flaws and things that it doesn’t really consider.
The mean is flawed in that it can be quite easily skewed by a small number of data items on the extreme ends of the spectrum, thus not providing an accurate picture of the whole selection. Whereas the median, while possibly providing a more accurate picture of the general quality of a selection, does not take the extreme ends of the spectrum into account at all; if a park's coaster selection had a median rating of 6/10, the top value could be a 7/10 or a 10/10 and it would make no difference.
With that in mind, I decided to come up with my own formula to determine the consistent strength of a selection. A formula that takes into account both the extreme ends of the spectrum and the general quality across the board. So let me present The Matt N Formula for Consistent Strength; the formula is as follows:
Matt N Formula for Consistent Strength = (Highest rating + Upper quartile)*(Lowest rating + Lower quartile)
I included the highest rating and the lowest rating to take into account the extreme ends of a selection, while I also integrated quartiles to provide a stronger picture of general quality throughout a selection.
Those of you who followed my Europe data analysis might remember that I initially attempted to use this formula to work out strength in general without really quantifying what strength was, but I later decided that this particular formula would work better to determine consistent strength.
When I applied the Matt N Formula for Consistent Strength to each park in the dataset, the top 10 most consistently strong coaster selections in North America were as follows:
| Ranking | Park | Highest Rating | Upper Quartile (to 1dp) | Lowest Rating | Lower Quartile (to 1dp) | Matt N Formula Score (to 1dp) | Quantity of Scoreable Coasters |
| 1 | Dollywood | 9.9 | 8.0 | 3.9 | 6.4 | 183.0 | 8 |
| 2 | Silver Dollar City | 9.7 | 9.3 | 3.5 | 6.0 | 180.7 | 6 |
| 3 | Kennywood | 9.3 | 7.2 | 4.2 | 5.2 | 155.3 | 8 |
| 4 | SeaWorld San Antonio | 8.8 | 7.6 | 3.4 | 5.6 | 147.6 | 5 |
| 5 | Knoebels | 9.4 | 7.5 | 2.7 | 5.9 | 145.3 | 5 |
| 6 | Busch Gardens Williamsburg | 9.7 | 9.0 | 1.1 | 6.4 | 140.3 | 9 |
| 7 | SeaWorld Orlando | 9.6 | 8.9 | 0.7 | 6.7 | 135.8 | 6 |
| 8 | Cedar Point | 10.0 | 8.9 | 1.5 | 5.4 | 130.6 | 16 |
| 9 | Six Flags Magic Mountain | 9.8 | 7.8 | 1.3 | 5.4 | 117.9 | 16 |
| 10 | Disney’s Magic Kingdom | 7.1 | 7.1 | 1.9 | 6.3 | 116.4 | 5 |
Let’s now summarise what we’ve learned…
Summary
So, what did we learn from this investigation?
Well, while the methods used did differ the results somewhat, there were some names that universally appeared in the top 10 regardless. And there was one park in particular that did shine, scoring highly on all 3 measures.
As it came top when using 2 of the 3 measures and came second in the measure that it didn’t win, I am saying that my data concludes that Silver Dollar City has North America’s most consistently strong coaster lineup. When a park comes out on top 2 out of 3 times and comes second the 3rd time (and a very close second, at that), it’s hard not to declare it the winner!
I’m aware that the results might not be what some expect, and in some ways, they weren’t what I would have expected either, but it is worth me reiterating that this is asking what North America’s most consistently strong coaster lineup is rather than what the strongest coaster lineup is in terms of the park’s highest rated coasters. If I honed in exclusively on each park’s strongest rated coasters (which I will do in a separate question), I can sense these results would look very different.
Also, just because my algorithm is saying that Silver Dollar City wins this, that’s not “the correct answer” by any means; it’s all down to personal opinion. The answer I’m showing here is merely the conclusion that my data analysis came to based off of the average opinions of a subset of coaster enthusiasts.
Just for reference, here is a box plot I created using Python’s MatPlotLib library to show the spread of ratings for each coaster selection and how they compare to one another in a visual way:
I’m aware that that’s a bit of a mess, so just for some idea, here is the order in which the parks appear, from left to right (the number at the side is the number of scoreable coasters the park has:
- Six Flags Magic Mountain (USA, California): 16
- Canada's Wonderland (Canada): 16
- Cedar Point (USA, Ohio): 16
- Six Flags Great America (USA, Illinois): 14
- Kings Island (USA, Ohio): 14
- Hersheypark (USA, Pennsylvania): 14
- Six Flags Great Adventure (USA, New Jersey): 13
- Carowinds (USA, North Carolina): 13
- Kings Dominion (USA, Virginia): 12
- Six Flags Over Texas (USA, Texas): 11
- Six Flags Over Georgia (USA, Georgia): 10
- Six Flags New England (USA, Massachusetts): 10
- Busch Gardens Tampa (USA, Florida): 10
- Six Flags Fiesta Texas (USA, Texas): 9
- Lagoon (USA, Utah): 9
- Knott's Berry Farm (USA, California): 9
- Six Flags St Louis (USA, Missouri): 9
- Busch Gardens Williamsburg (USA, Virginia): 9
- Six Flags Discovery Kingdom (USA, California): 8
- Six Flags America (USA, Maryland): 8
- La Ronde (Canada): 8
- Dollywood (USA, Tennessee): 8
- Six Flags Mexico (Mexico): 8
- Kennywood (USA, Pennsylvania): 8
- Six Flags Darien Lake (USA, New York): 7
- Valleyfair (USA, Minnesota): 7
- Morey's Piers (USA, New Jersey): 6
- Worlds of Fun (USA, Missouri): 6
- Michigan's Adventure (USA, Michigan): 6
- Silver Dollar City (USA, Missouri): 6
- Dorney Park (USA, Pennsylvania): 6
- SeaWorld Orlando (USA, Florida): 6
- Kentucky Kingdom (USA, Kentucky): 6
- Luna Park (USA, New York): 5
- Indiana Beach (USA, Indiana): 5
- Great Escape (USA, New York): 5
- SeaWorld San Antonio (USA, Texas): 5
- Knoebels (USA, Pennsylvania): 5
- Disney's Magic Kingdom (USA, Florida): 5
- Nickelodeon Universe Theme Park (USA, New Jersey): 5
- Disneyland (USA, California): 5
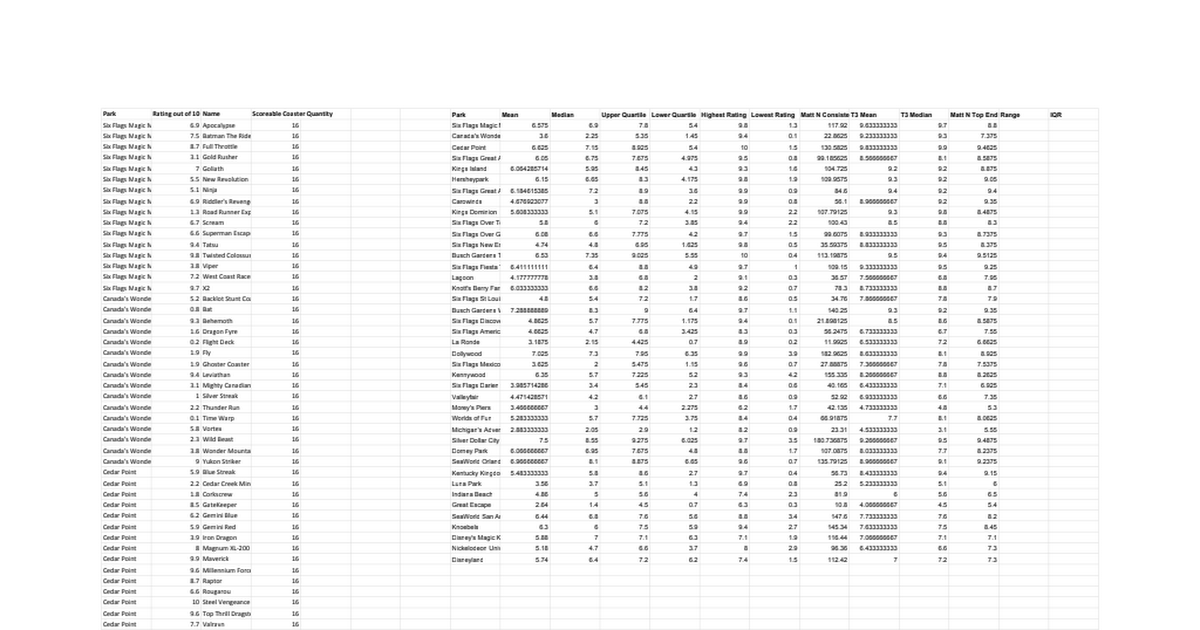
A Quantitative Analysis of North America's Major Coaster Selections
Raw Data Park,Rating out of 10,Name,Scoreable Coaster Quantity,Park,Mean,Median,Upper Quartile,Lower Quartile,Highest Rating,Lowest Rating,Matt N Consistent Strength Formula,T3 Mean,T3 Median,Matt N Top End Strength Formula,Range,IQR Six Flags Magic Mountain,6.9,Apocalypse,16,Six Flags Magic Mou...
But if any of you have any suggestions for questions about this dataset you’d like me to try and answer, then I’m very happy to accept suggestions!
")